A 2023 guide to Jira Burndown charts

I Updated
A 2023 guide to Jira Burndown charts

Resource

Select topics that best match this listing. Limited to 6.
Select all that apply. If the resource is platform agnostic, ignore this selection.
Limited to four options.
Article
Duration in Minutes
Total time in minutes that it will take to consume this content
6
Free
Level
Select expertise level required for consumption of this resource
Beginner
Audience
Who is this resource for
Created by
Type to select a company name offering this resource
Company Website
The website where visitors can learn more about this vendor or expert
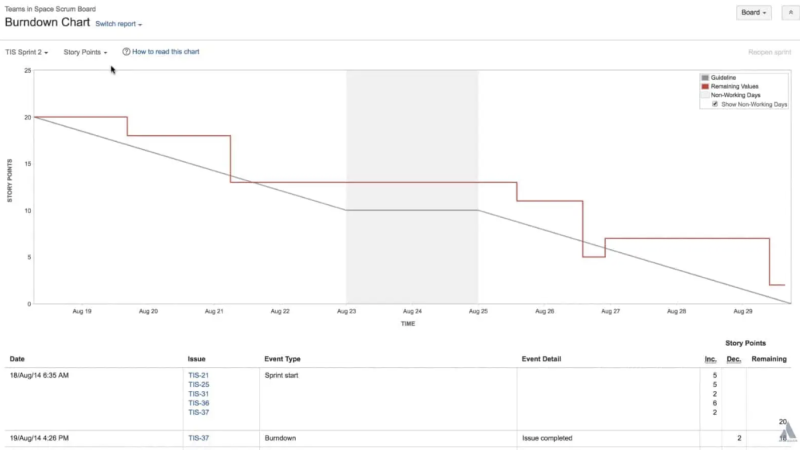
Jira Software offers various tools for tracking performance and progress. One of its prominent features is the burndown chart, which visually represents the team's output in relation to projected work estimations during sprints and epics. This article explores the concept of burndown charts and their advantages, and provides guidance on creating and interpreting them. 
It covers Jira burndown charts concepts, their benefits, step-by-step instructions for creating them, and understanding how to interpret them.

User reviews

There are no user reviews for this listing.
Ratings
Topic coverage
Were you satisfied with the quality of the content?
Quality of production
Was the resource well produced and easily comprehended?
Comments